PMS5003
The Sniffer
Where we end up
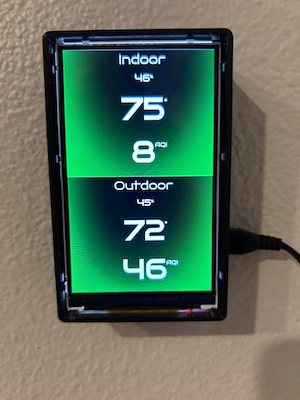
The goal is to put the data on display. I wanted an easy way to have a quick view into how the AQI is fairing both indoors & outdoors. Even though this is a simplified view of PM2.5 AQI and doesn't roll in Ozone or NH3, it's still a nice quick check on what's going on. For this post I'll cover the muscle of one of these sensors. The Particulate Matter Sensor.
Just a note first, I'll try to link to places where you can buy these things. I'm assuming no traffic will hit these pages, so I'm not bothering with affiliate linking. I'll also generally try to find things on Adafruit because they're awesome! Lastly this is not intended as product review or as deep technical dive. It's primarily to introduce the components that make this DIY AQI monitor work.

The sensor
The Plantower PMS5003 is the engine that makes this stack work. This manual has a detailed view into how the sensor works, what data it collects and it's performance characteristics. For my purposes I'm primary focused on it's ability to detect the μ g/m³ of 2.5μ m particles, or the amount of "stuff" that is 2.5 micro-meters wide in a cubic meter of air.
The sensor works using freaking a laser. It has a small fan that pushes air into a chamber. A laser is aimed into that chamber, and any small particles that are present in the air, cause some of the laser's light to scatter. Using the MIE Theory, an onboard microprocessor can calculate how many particles are suspended in the air sample, as well as their size.
Most of the math is above my pay-grade, but my incorrect layman's approach to understanding this is to think about trying to bounce a tennis ball off of a basketball. Say there's a basketball on the ground directly below where a tennis ball is suspended. If I can manage to have the ball travel in a straight line and bounce of the point at the very top of the basketball, in theory the tennis ball would bounce straight up. If the tennis ball hits anywhere but the very top, it will veer off in the direction that the basketball slopes down from it's peak.
Lasers it turns out, are not just cool in the sci-fi sense, they also have a very useful property. They hare made up of light waves that are a beam of photons that all travel in the same direction with the same wavelength. This property lets them work somewhat like the tennis ball above, but they have even more interesting details about the surface they bounced off off. Because photos are both particles and waves, they are not just traveling in a straight line; they are vibrating at a fixed frequency so when they strike a curved surface the photons will hit the surface at different point in their wave. That will further influence how they are redirected. These patterns allow the sensor to build detailed maps of the particles in the air sample.
Back in my lane
For me the the part that matters the most is the Data 2 refers to PM2.5 concentration unit μ g/m3(CF=1, standard particle data stream. There's a handy bit of python that will read the data from the PMS5003. I've got code to write it into a SQLITE 3 database every 60 seconds.
It's this data that is fed into the AQI calculation and eventually shown on the screen above; or as the raw data in the chart below. The science behind the data collection is definitely pretty intense, but in the end, the calculated values are pretty straightforward to work with.

QOTD
“Hope for the Best. Expect the worst. Life is a play. We're unrehearsed.” ― Mel Brooks