AQI Everywhere
Measured Breath
Hobby Horses
I'm a hobbyist at best when it comes to Raspberry Pi. I have a dozen or so doing various tasks around the house from a RetroPie to play Duke Nukem to a PiHole to limit the prying eyes of the web-ad-media-muck, to basic things like a clock/message board, hubs for smart-ish devices like rooted OpenMiko Cameras, or photo frames.
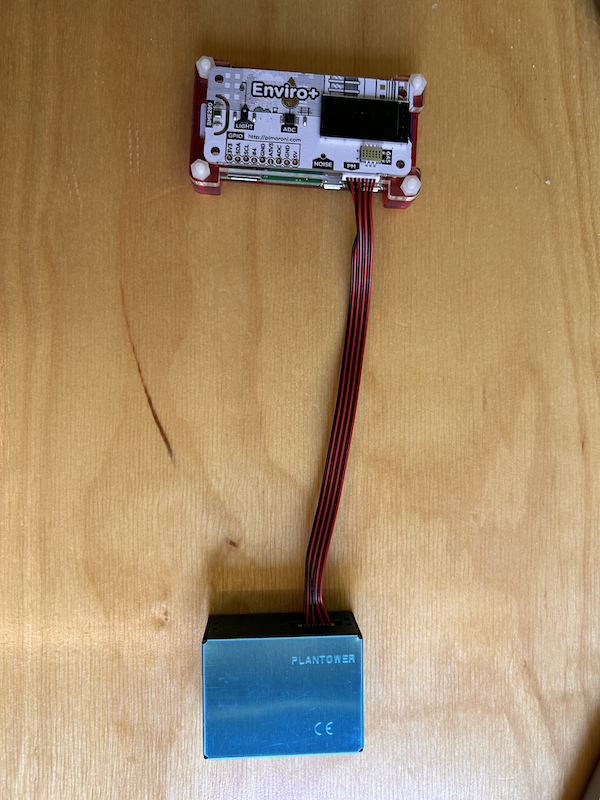
I've had a lot of fun just goofing around with the Pi's and Arduino, and ESP8266 boards, but the most interesting thing for me has been AQI Sensors. I got starting with the Enviro+ and a PiZero WH and most importantly a Plantower PMS5003 laser Particulate Matter Sensor.

Data for Everyone
Over a few posts I'll walk through the different stages of how this has evolved for me, but we'll start at the end. It's all about making it easy to understand AQI. There are definitely off the shelf ways to get this data like Purple Air, or more in depth analysis like Air Advice, but for me part of the fun is seeing how things work.
A few caveats. The data that's being read by the sensor that I have inside & outside are producing approximate results. I don't have a lab and I can't calibrate the sensors, but when i see an outdoor AQI of 120+ I know it's bad and I should make sure the windows are closed (not to mention my nose can often confirm the particulate matter).

What Am I Looking At
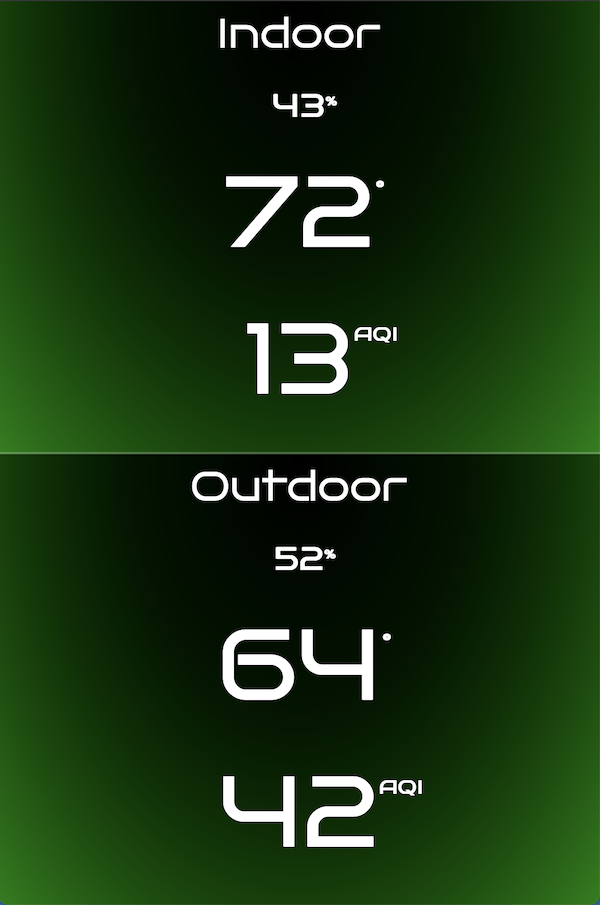
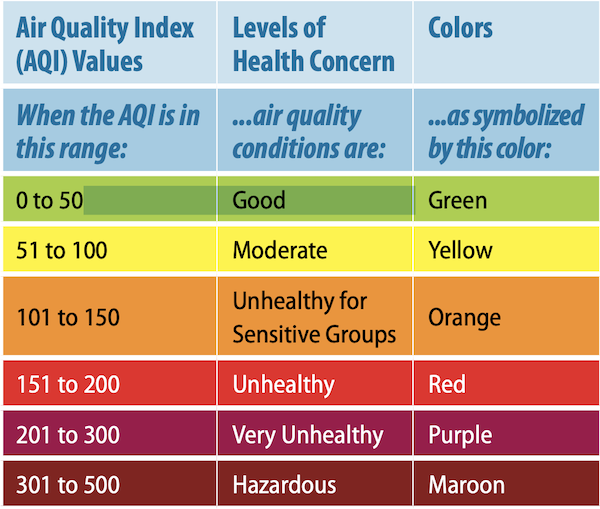
A bit about AQI So underneath this display, there is a bit of math. It intakes the PM 2.5 particulate matter data from the PMS5003 sensor, and applies this calculation to create an AQI. That AQI is then compared with a set of ranges to determine how safe the air is to breath or exercise in.
This UI displays the calculated AQI, but it also uses color queues to help indicate what's going on. It's a pretty basic system. I've played around with a bunch of web UIs to surface this data, but I've found this UI, which is displayed on a Pimoroni HyperPixel.

Why Again?
This really kicked off for me during some extremely bad fires in the Pacific Northwest. It hammered home that we're in a different time and it's important for me to have visibility into my environment. It's not just fires. I've found it extremely helpful to know what happens to our Indoor Air when I cook. I was a bit shocked at how a little smoke from a pan can spike the AQI into Unhealthy. It reenforced the need to keep the vent fan on, to open windows or otherwise disperse bad air.
What's Next?
I want to walk through the tech stack, and building one either with the Enviro+ or with base components. I want to walk through the historical data, how I've used it and how I've played with different visualizations. Lastly I want to keep learning. If you clicked though to the AQI Calculation link you may have noticed that that method is now obsolete. That's a bonus adventure for me, I guess I'm always winning the prize.
OOTD
"You cannot affirm the power plant and condemn the smokestack, or affirm the smoke and condemn the cough." —Wendell Berry, The Gift of the Good Land, 1981.